RCSB PDB - 1QSF: STRUCTURE OF A6-TCR BOUND TO HLA-A2 COMPLEXED WITH ALTERED HTLV-1 TAX PEPTIDE Y8A

 1QSF

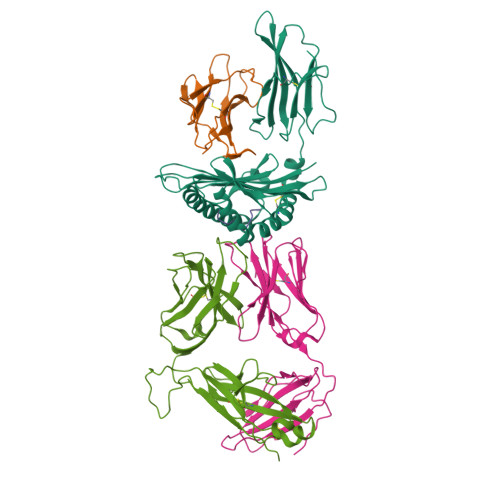
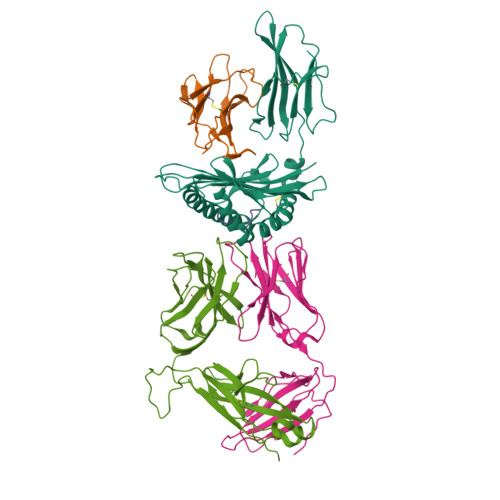
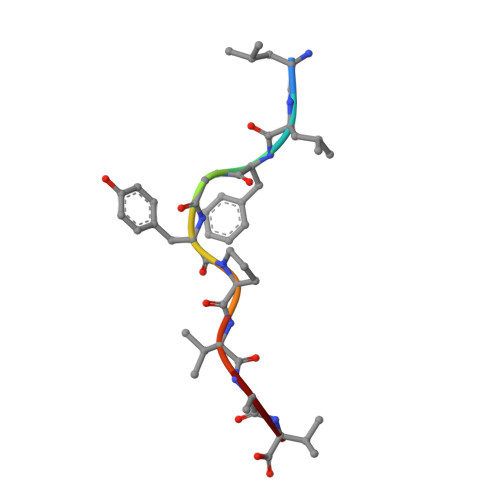
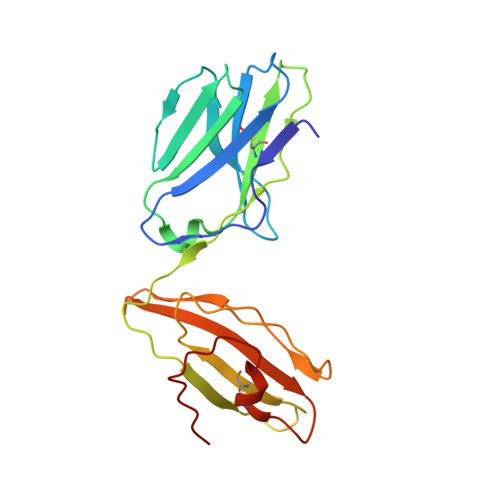
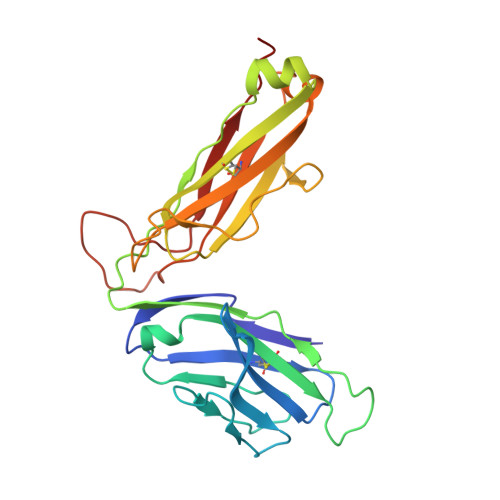
STRUCTURE OF A6-TCR BOUND TO HLA-A2 COMPLEXED WITH ALTERED HTLV-1 TAX PEPTIDE Y8A


Experimental Data Snapshot

  • Method: X-RAY DIFFRACTION
  • Resolution: 2.80 Å
  • R-Value Free: 0.286 
  • R-Value Work: 0.245 

wwPDB Validation   3D Report Full Report


This is version 1.4 of the entry. See complete history


Literature

Four A6-TCR/peptide/HLA-A2 structures that generate very different T cell signals are nearly identical.

Ding, Y.H.Baker, B.M.Garboczi, D.N.Biddison, W.E.Wiley, D.C.

(1999) Immunity 11: 45-56

  • DOI: https://doi.org/10.1016/s1074-7613(00)80080-1
  • Primary Citation of Related Structures:  
    1QRN, 1QSE, 1QSF

  • PubMed Abstract: 

    The interactions of three singly substituted peptide variants of the HTLV-1 Tax peptide bound to HLA-A2 with the A6 T cell receptor have been studied using T cell assays, kinetic and thermodynamic measurements, and X-ray crystallography. The three peptide/MHC ligands include weak agonists and antagonists with different affinities for TCR. The three-dimensional structures of the three A6-TCR/peptide/HLA-A2 complexes are remarkably similar to each other and to the wild-type agonist complex, with minor adjustments at the interface to accommodate the peptide substitutions (P6A, V7R, and Y8A). The lack of correlation between structural changes and the type of T cell signals induced provides direct evidence that different signals are not generated by different ligand-induced conformational changes in the alphabeta TCR.


  • Organizational Affiliation

    Department of Molecular and Cellular Biology, Harvard University, Cambridge, Massachusetts 02138, USA.


Macromolecules
Find similar proteins by:  (by identity cutoff)  |  3D Structure
Entity ID: 1
MoleculeChains Sequence LengthOrganismDetailsImage
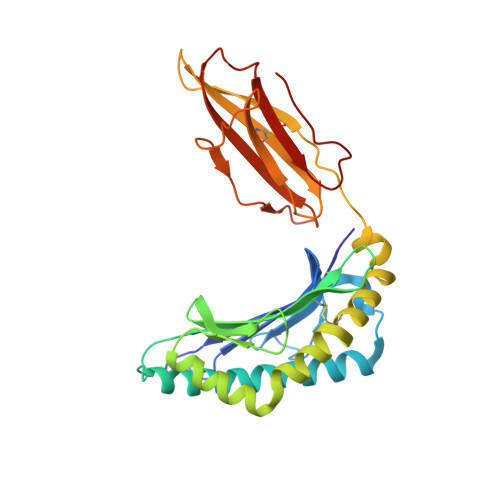
MHC CLASS I HLA-A274Homo sapiensMutation(s): 0 
UniProt & NIH Common Fund Data Resources
Find proteins for P04439 (Homo sapiens)
Explore P04439 
Go to UniProtKB:  P04439
PHAROS:  P04439
GTEx:  ENSG00000206503 
Entity Groups  
Sequence Clusters30% Identity50% Identity70% Identity90% Identity95% Identity100% Identity
UniProt GroupP04439
Sequence Annotations
Expand
  • Reference Sequence
Find similar proteins by:  (by identity cutoff)  |  3D Structure
Entity ID: 2
MoleculeChains Sequence LengthOrganismDetailsImage
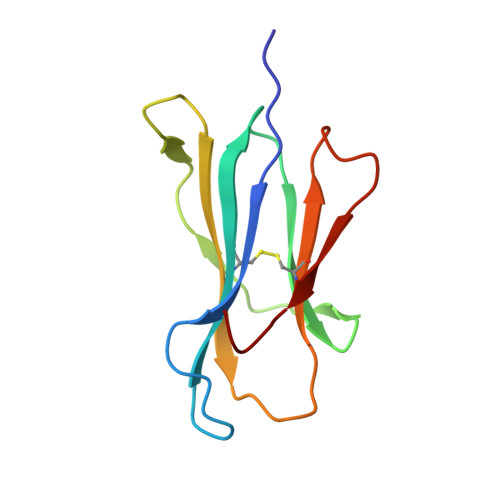
BETA-2 MICROGLOBULIN100Homo sapiensMutation(s): 1 
UniProt & NIH Common Fund Data Resources
Find proteins for P61769 (Homo sapiens)
Explore P61769 
Go to UniProtKB:  P61769
PHAROS:  P61769
GTEx:  ENSG00000166710 
Entity Groups  
Sequence Clusters30% Identity50% Identity70% Identity90% Identity95% Identity100% Identity
UniProt GroupP61769
Sequence Annotations
Expand
  • Reference Sequence

Find similar proteins by:  Sequence   |   3D Structure  

Entity ID: 3
MoleculeChains Sequence LengthOrganismDetailsImage
TAX PEPTIDE Y8A9N/AMutation(s): 0 
Sequence Annotations
Expand
  • Reference Sequence
Find similar proteins by:  (by identity cutoff)  |  3D Structure
Entity ID: 4
MoleculeChains Sequence LengthOrganismDetailsImage
HUMAN T-CELL RECEPTOR200Homo sapiensMutation(s): 0 
UniProt & NIH Common Fund Data Resources
Find proteins for P01848 (Homo sapiens)
Explore P01848 
Go to UniProtKB:  P01848
PHAROS:  P01848
Entity Groups  
Sequence Clusters30% Identity50% Identity70% Identity90% Identity95% Identity100% Identity
UniProt GroupP01848
Sequence Annotations
Expand
  • Reference Sequence
Find similar proteins by:  (by identity cutoff)  |  3D Structure
Entity ID: 5
MoleculeChains Sequence LengthOrganismDetailsImage
HUMAN T-CELL RECEPTOR243Homo sapiensMutation(s): 0 
Entity Groups  
Sequence Clusters30% Identity50% Identity70% Identity90% Identity95% Identity100% Identity
Sequence Annotations
Expand
  • Reference Sequence
Experimental Data & Validation

Experimental Data

  • Method: X-RAY DIFFRACTION
  • Resolution: 2.80 Å
  • R-Value Free: 0.286 
  • R-Value Work: 0.245 
  • Space Group: C 1 2 1
Unit Cell:
Length ( Å )Angle ( ˚ )
a = 224.665α = 90
b = 48.46β = 90.46
c = 93.739γ = 90
Software Package:
Software NamePurpose
DENZOdata reduction
SCALEPACKdata scaling
CNSrefinement
CNSphasing

Structure Validation

View Full Validation Report


Entry History 

Deposition Data

Revision History  (Full details and data files)

  • Version 1.0: 1999-12-21
    Type: Initial release
  • Version 1.1: 2008-04-27
    Changes: Version format compliance
  • Version 1.2: 2011-07-13
    Changes: Version format compliance
  • Version 1.3: 2021-11-03
    Changes: Database references
  • Version 1.4: 2024-10-16
    Changes: Data collection, Structure summary