3MRO

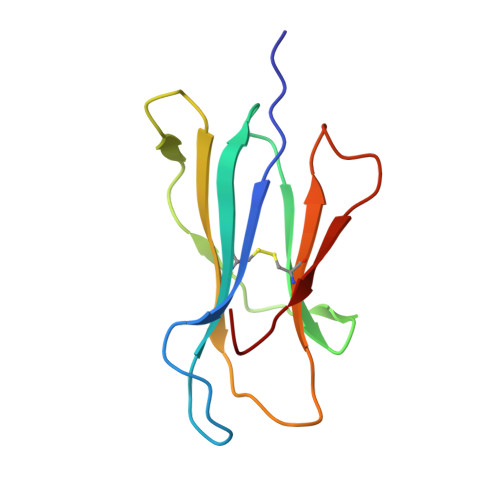
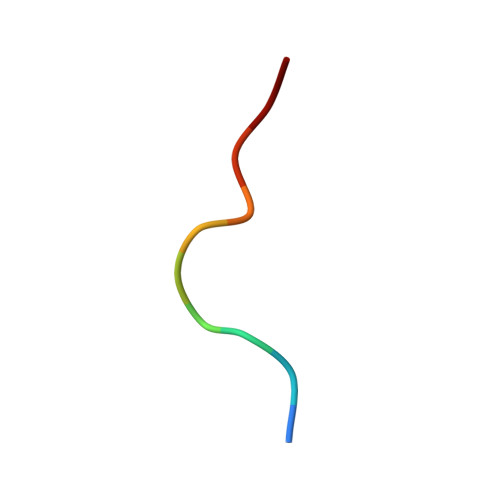
Crystal Structure of MHC class I HLA-A2 molecule complexed with Melan-A MART1 decapeptide variant


Experimental Data Snapshot

  • Method: X-RAY DIFFRACTION
  • Resolution: 2.35 Å
  • R-Value Free: 0.279 
  • R-Value Work: 0.219 
  • R-Value Observed: 0.224 

Starting Model: experimental
View more details

wwPDB Validation   3D Report Full Report


This is version 1.4 of the entry. See complete history


Literature

Analysis of Relationships between Peptide/MHC Structural Features and Naive T Cell Frequency in Humans.

Reiser, J.B.Legoux, F.Gras, S.Trudel, E.Chouquet, A.Leger, A.Le Gorrec, M.Machillot, P.Bonneville, M.Saulquin, X.Housset, D.

(2014) J Immunol 193: 5816-5826

  • DOI: https://doi.org/10.4049/jimmunol.1303084
  • Primary Citation of Related Structures:  
    3MRC, 3MRD, 3MRE, 3MRG, 3MRH, 3MRL, 3MRO, 3MRR

  • PubMed Abstract: 

    The structural rules governing peptide/MHC (pMHC) recognition by T cells remain unclear. To address this question, we performed a structural characterization of several HLA-A2/peptide complexes and assessed in parallel their antigenicity, by analyzing the frequency of the corresponding Ag-specific naive T cells in A2(+) and A2(-) individuals, as well as within CD4(+) and CD8(+) subsets. We were able to find a correlation between specific naive T cell frequency and peptide solvent accessibility and/or mobility for a subset of moderately prominent peptides. However, one single structural parameter of the pMHC complexes could not be identified to explain each peptide antigenicity. Enhanced pMHC antigenicity was associated with both highly biased TRAV usage, possibly reflecting favored interaction between particular pMHC complexes and germline TRAV loops, and peptide structural features allowing interactions with a broad range of permissive CDR3 loops. In this context of constrained TCR docking mode, an optimal peptide solvent exposed surface leading to an optimal complementarity with TCR interface may constitute one of the key features leading to high frequency of specific T cells. Altogether our results suggest that frequency of specific T cells depends on the fine-tuning of several parameters, the structural determinants governing TCR-pMHC interaction being just one of them.


  • Organizational Affiliation

    Université de Grenoble Alpes, Institut de Biologie Structurale, F-38044 Grenoble, France; Commissariat à l'énergie atomique et aux énergies alternatives, Direction des sciences du vivant, Institut de Biologie Structurale, F-38044 Grenoble, France; Centre national de la recherche scientifique, Institut de Biologie Structurale, F-38044 Grenoble, France;


Macromolecules
Find similar proteins by:  (by identity cutoff)  |  3D Structure
Entity ID: 1
MoleculeChains Sequence LengthOrganismDetailsImage
HLA class I histocompatibility antigen, A-2 alpha chain293Homo sapiensMutation(s): 1 
Gene Names: HLAHLA-AHLAA
UniProt & NIH Common Fund Data Resources
Find proteins for P04439 (Homo sapiens)
Explore P04439 
Go to UniProtKB:  P04439
PHAROS:  P04439
GTEx:  ENSG00000206503 
Entity Groups  
Sequence Clusters30% Identity50% Identity70% Identity90% Identity95% Identity100% Identity
UniProt GroupP04439
Sequence Annotations
Expand
  • Reference Sequence
Find similar proteins by:  (by identity cutoff)  |  3D Structure
Entity ID: 2
MoleculeChains Sequence LengthOrganismDetailsImage
Beta-2-microglobulin100Homo sapiensMutation(s): 0 
Gene Names: B2MBETA-2 MICROGLUBULINCDABP0092HDCMA22P
UniProt & NIH Common Fund Data Resources
Find proteins for P61769 (Homo sapiens)
Explore P61769 
Go to UniProtKB:  P61769
PHAROS:  P61769
GTEx:  ENSG00000166710 
Entity Groups  
Sequence Clusters30% Identity50% Identity70% Identity90% Identity95% Identity100% Identity
UniProt GroupP61769
Sequence Annotations
Expand
  • Reference Sequence

Find similar proteins by:  Sequence   |   3D Structure  

Entity ID: 3
MoleculeChains Sequence LengthOrganismDetailsImage
10-meric peptide from Melanoma antigen recognized by T-cells 1C [auth P]10Homo sapiensMutation(s): 1 
UniProt & NIH Common Fund Data Resources
Find proteins for Q16655 (Homo sapiens)
Explore Q16655 
Go to UniProtKB:  Q16655
PHAROS:  Q16655
GTEx:  ENSG00000120215 
Entity Groups  
Sequence Clusters30% Identity50% Identity70% Identity90% Identity95% Identity100% Identity
UniProt GroupQ16655
Sequence Annotations
Expand
  • Reference Sequence
Experimental Data & Validation

Experimental Data

  • Method: X-RAY DIFFRACTION
  • Resolution: 2.35 Å
  • R-Value Free: 0.279 
  • R-Value Work: 0.219 
  • R-Value Observed: 0.224 
  • Space Group: P 1 21 1
Unit Cell:
Length ( Å )Angle ( ˚ )
a = 53.881α = 90
b = 81.076β = 113.8
c = 57.276γ = 90
Software Package:
Software NamePurpose
XSCALEdata scaling
REFMACrefinement
PDB_EXTRACTdata extraction
XDSdata reduction
AMoREphasing

Structure Validation

View Full Validation Report


Entry History 

Deposition Data

Revision History  (Full details and data files)

  • Version 1.0: 2011-05-25
    Type: Initial release
  • Version 1.1: 2011-07-13
    Changes: Version format compliance
  • Version 1.2: 2015-01-28
    Changes: Database references
  • Version 1.3: 2023-11-01
    Changes: Data collection, Database references, Refinement description
  • Version 1.4: 2024-11-20
    Changes: Structure summary